How much have temperatures risen in recent decades? According to this graph, very, very fast. This work by Alexander Radtke, a 30-year-old engineer from Duisburg (Germany), collects the variations in global average temperatures between 9980 BC and 2020. He published it in a tweet that has been shared about 9,000 times in three days.
The last 12,000 years. pic.twitter.com/5KAnqmO2Tv
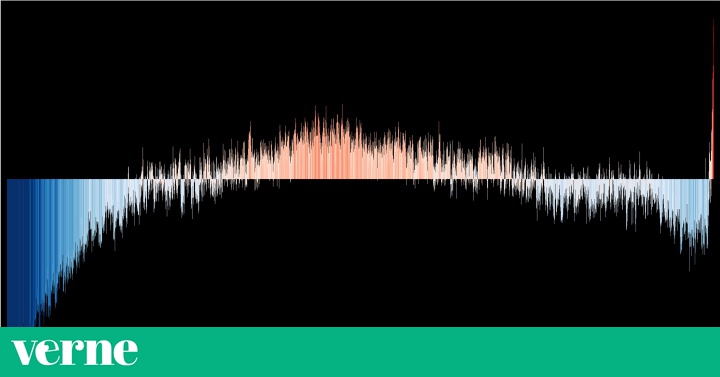
- Alexander Radtke (@alxrdk) August 16, 2020Radtke, who works in the renewable energy sector, explains in his thread that the center line, which serves as the basis for comparisons, is the average temperature of the 20th century. The coldest temperature is 1.37 degrees Celsius below, coinciding with the end of the ice age. The maximum variation above has been reached this year, with a temperature 0.99 degrees higher than the average.
Radtke has also published an enlargement of the graph in which the variation of the last 170 years can be seen in more detail. The graph shows a cooling of global temperatures until the current accelerated warming begins:
btw this is zoomed into the last 170 years and leaving out the previous 11830 shown above. pic.twitter.com/rW0fOhLqdy
- Alexander Radtke (@alxrdk) August 16, 2020By the way, this is a zoom of the last 170 years, leaving out the previous 11,830 shown above.
This engineer explains to Verne by email that his visualizations follow the work done by Ed Hawkins, Professor of Climate Sciences at the University of Reading, UK. Hawkins is known for the Show your stripes project, which allows us to appreciate the variation in temperatures both globally and by country since 1901.
Like Hawkins, Radtke believes these images can be helpful in appreciating change. In the case of this new graph, he explains that combining bars with different colors and also heights, “gives more visibility to the unprecedented change that we have seen (and caused) during the last decades. So it is very clear that none of this is close to normal ”.
Radtke has also produced visualizations that show the different predicted scenarios of temperature evolution, depending on what actions we take to prevent warming. In his opinion, we have not done nor are we doing enough to avoid the worst consequences: "The rate of change in temperatures is too high for the inertia of the complex systems that we have built and that make our comfortable lives possible."
Where does the pre-thermometer data come from
Radtke cites sources for records from the last millennia in his thread. As we mentioned in this other article on the evolution of mean global temperatures, since 1850 there are enough records of thermometers to estimate these changes. For previous years it is necessary to resort to indirect methods, such as tree rings, ice cores and corals, among other sources.
There is greater uncertainty in these estimates than for recent data, but in addition to being considered sufficiently solid, they are updated year by year. The ones that are considered most reliable are those obtained from the ice in Greenland and Antarctica, thanks to the air bubbles that are trapped and that provide information from up to 800,000 years ago, according to Francisco Javier Sierro, professor and director of the Ocean Geosciences group of the University of Salamanca.
Radtke adds that, despite all these uncertainties, "we can be fairly certain about the upper and lower limits of the general climate during any century of the Holocene" (the current geological time period, which began about 11,700 years ago). Only mean temperatures appear on your graph, but your intention is to create a version that includes the uncertainty ranges.
A more intense heating
As Sierro, from the University of Salamanca, also explained, since the end of the Ice Age "the temperature is stable, with small changes of less than one degree", until recent warming. This warming, the current one, is the most pronounced in the last millennia.
Earth's climate is changeable, and changes affect each Earth's climate zone differently. For example, phenomena such as solar activity, volcanic eruptions, the orbit of the planet and the circulation of the oceans have influenced over thousands of years. The particularity of the current warming is that it is caused by the action of the human being and by the greenhouse gases that come from the burning of fossil fuels.
Radtke adds that throughout history humans have also caused changes in regional climates, "especially during the extensive deforestation in Europe during the Middle Ages." But remember that "all these changes are not even close to the warming that started especially after the First World War and which accelerated again in the 70s. And it continues to do so." For example, sometimes the so-called "medieval climatic optimum" period is spoken of to try to defend that the rise in temperatures is not necessarily something negative. Both in this graph and in other similar ones it can be seen that the rise in temperatures between the 700s and 1200 is not as pronounced as the current one.
* You can also follow us on Instagram and Flipboard. Don't miss out on the best of Verne!