Google updates Maps again to provide more information on the pandemic.
The latest update, coming for iPhones and Android smartphones, shows the incidence of coronavirus cases nationwide, regionally and in some cities, so you can make informed decisions about where to go and what to do.
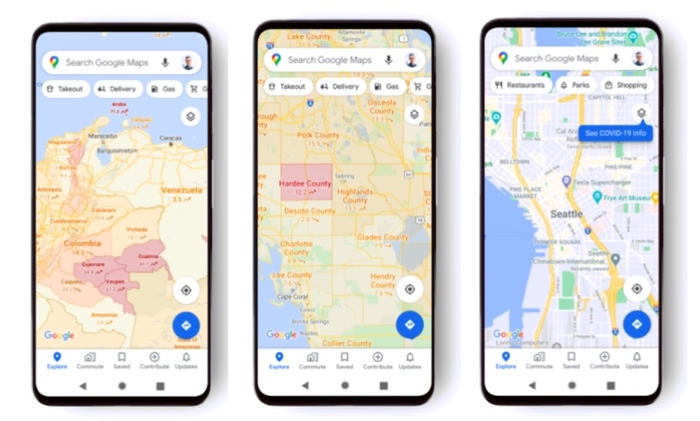
By selecting the item dedicated to Covid in the Maps, accessible through the "Levels" icon, the weekly average of new cases per 100 thousand inhabitants in the area you are looking at will appear, and an arrow will indicate whether the number of new infections is increasing or decreasing.
Furthermore, to understand the spread of the epidemic at a glance, the areas of the map will be colored in different ways: gray for less than 1 case in 100 thousand inhabitants, yellow up to 10 cases, orange up to 20, dark orange up to 30, red up to 40 and dark red over 40 cases.
In a note, Google explains that it draws on information provided by authoritative sources such as Johns Hopkins, New York Times and Wikipedia, which in turn draw data from WHO and local health authorities.