
A second wave of Covid-19 slower to arrive than the first, but which is overwhelming more of the country.
Here is what we observe on the evolution of the tension in the intensive care units of the various French departments since March 18 (the first day when the data of Public Health France are available).
We produced an animated map of France representing, for each day, the number of patients in intensive care in each territory per 100,000 inhabitants.
When we speak of patients "in intensive care", this actually includes all patients in "critical care", who can be taken care of in the intensive care unit, intensive care, or continuous monitoring, indicates Public Health France.
The national peak was reached on April 8, with 7,019 beds occupied
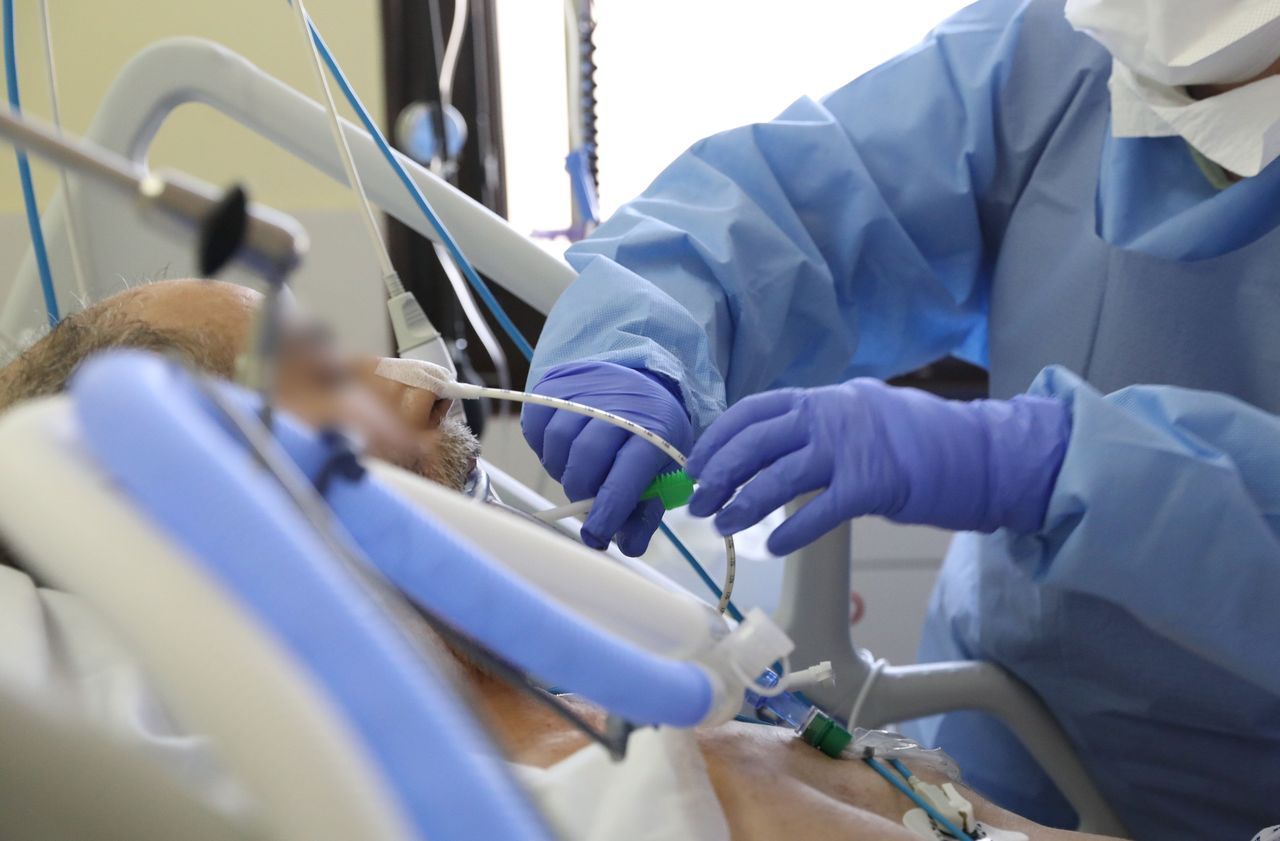
rea covid
Fortunately, in some regions, particularly in large metropolitan areas, the number of new hospital and intensive care admissions seems to have reached a kind of plateau, or even started to decline very slowly.
A kind of calm, mentioned Monday by the Director General of Health Jérôme Salomon.
"At the start of this week [since Monday, November 9, Editor's note], we had the impression of a shift, but we are waiting for the weekend and the weekend to confirm it", advance cautiously Vincent Das, head of intensive care unit at André Grégoire hospital, in Montreuil.