Restrictions increase in the cities of El Paso and Ciudad Júarez 3:37
(CNN) -
Official COVID-19 cases and hospitalizations in the United States are accumulating at record rates, and experts fear that the same will soon be the case with the number of daily deaths.
The charts below show how the fall coronavirus wave has left the United States in unprecedented ground by some metrics.
And, with the numbers rising, they point to how the situation could worsen as the country waits for a vaccine and the distribution of new treatments.
Daily Case Counts Hit New Highs
The gray bars represent the
number of new cases reported each day.
The dashed red line shows the seven-day moving average.
Last Updated: November 13, 2020 at 1:36 pm ET.
Source: Johns Hopkins University Center for Systems Science and Engineering.
Graphic: Curt Merrill, CNN.
A short time ago, in September, daily cases fell as the country recovered from the summer surge.
But the infections grew back in a way that had not been recorded until now.
Thursday saw the highest number of infections in a day in the United States (more than 153,000) and the highest seven-day average of new infections per day (more than 131,000), according to data from Johns Hopkins University.
That average is more than 3.5 times higher than on Sept. 12, when it was at a post-summer low of 34,198.
advertising
And it's well above the highest seven-day average of the summer, which was around 67,100 on July 22.
There was good news recently.
One of the possible vaccines was reported to be more than 90% effective.
And the Secretary of Health and Human Services said vaccines could be widely available in the second quarter of 2021. In addition, the Food and Drug Administration approved a new antibody treatment this week that may reduce the risk of patients with mild to moderate illness are hospitalized.
LOOK: UPS will send dry ice to the US to help store Pfizer's covid-19 vaccine
However, with colder weather conducive to risky indoor gatherings and no vaccine available at this time, experts warn that daily infections have room to grow.
"It won't surprise me if we see more than 200,000 new cases a day in the next few weeks," Michael Osterholm, director of the Center for Infectious Disease Research and Policy at the University of Minnesota, told CNN on Monday.
We must emphasize that the table shows the reported cases.
Some studies have estimated that infections were highly underestimated, especially at the beginning of the pandemic, in part due to limited availability of tests.
Some health experts have said that hospitalizations may be a more realistic measure of the severity of the pandemic.
However, the increase in cases is a warning sign, as hospitalization of a patient can occur long after diagnosis.
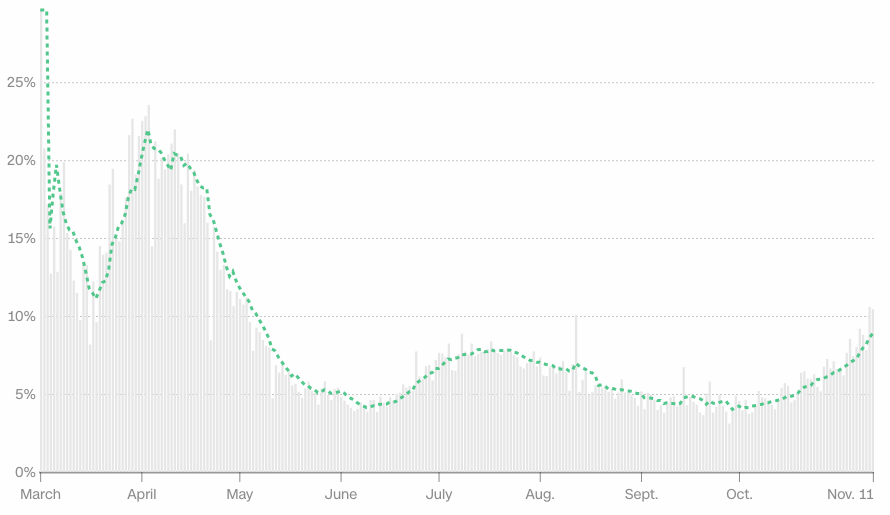
The 'most sensitive indicator' of covid-19 in the US increases
The gray bars represent the
percentage of new tests that are positive for COVID-19.
The dashed green line shows the seven-day moving average. The initial rise in positive rates in March and April was due in part to a lack of available evidence in the first affected states, such as Washington, New York and California, where authorities they prioritized testing in people with symptoms.
Since there is no federal standard for reporting COVID-19 test data, national positivity rates may include inconsistencies.
Last update: November 12, 2020.
Source: Covid monitoring project.
Graphic: Daniel Wolfe, CNN
The test positivity rate is the percentage of people who are tested and found to be infected.
And the US rate has skyrocketed in recent weeks.
The country's test positivity rate averaged 8.7% in the seven days through early Thursday, according to the Covid Tracking Project.
That's above the highest seven-day average of the summer, which was close to 7.9% in mid-July.
This image shows what the
seven-day positivity rate
was
in each state
as of Wednesday.
Since reporting methods and data quality vary, positivity rates may not be directly comparable between states.
Last Updated: November 12, 2020.
Source: Johns Hopkins University analysis of Covid Tracking Project data.
Graphic: Daniel Wolfe, CNN.
The World Health Organization advised governments in May not to reopen until test positivity rates were 5% or less for at least 14 days.
LEE: California is the second state in the United States to exceed one million cases of covid-19, after Texas
And the director of the US Centers for Disease Control and Prevention, Dr. Robert Redfield, has suggested that community positivity rates should be below 5% to keep schools open comfortably.
The coordinator of the White House coronavirus task force, Dr. Deborah Birx, has said the test positivity rate is the statistic she looks most closely at.
He explained that it is "the most sensitive indicator" of how the coronavirus situation is developing at a particular time and place.
U.S. hospitals have more covid-19 patients than ever
Last update: November 12, 2020.
Source: Covid monitoring project.
Graphic: Daniel Wolfe, CNN.
There are more COVID-19 patients in US hospitals now than at any time before the pandemic, according to reports.
Roughly 65,300 coronavirus patients were at those facilities Wednesday, according to the Covid Tracking Project.
That's more than double the number on September 20, when the country was at a low of 28,608 after the summer rally.
The figure is also above the summer peak of 59,718, which was recorded on July 23.
And from the spring peak of 59,940 on April 15.
Texas requests morgue trucks in emergency for covid-19 2:10
"The new record for hospitalizations underscores that we have entered the worst period of the pandemic since the original outbreak in the Northeast," two co-founders of the Covid Tracking Project wrote in an online post Wednesday.
“These hospitalization figures show that the current increase in COVID-19 cases is not simply the result of more screenings of asymptomatic people.
Rather, the cases we are detecting are a leading indicator that many people are seriously ill, ”the publication reads.
Some hospital systems said in recent days that they are close to overflowing.
A total of 17 states reported records of COVID-19 hospitalizations on Tuesday: Alaska, Arkansas, Colorado, Indiana, Iowa, Kentucky, Minnesota, Missouri, Montana, Nebraska, Ohio, Oklahoma, Oregon, South Dakota, Tennessee, Wisconsin and Wyoming said the follow-up project.
The hospitalization figures have likely gotten more accurate over time.
Florida, for example, did not report its hospitalizations until July 10, the project notes.
The number of lives lost is also on the rise
The dashed orange line shows the seven-day moving average.
The seven-day average is calculated by averaging the current day with the figures for the previous six days.
Using averaging reduces the effects of dips and spikes in data that are caused by delays in reporting or changes in data collection.
Last Updated: November 13, 2020 at 1:36 pm ET.
Source: Johns Hopkins University Center for Systems Science and Engineering.
Graphic: Curt Merrill, CNN.
Recent daily death toll from COVID-19 is not in record territory, but it is skyrocketing.
The average number of deaths per day over the course of a week rose above 1,000 this week for the first time since the summer.
That average was 1,034 on Wednesday, the highest since Aug. 10, Johns Hopkins data shows.
More than 1,380 deaths were reported on Wednesday alone.
The University of Washington Institute for Health Metrics and Evaluation projects that the United States could average more than 1,650 deaths per day by December 1 and more than 2,200 per day by January 1.
This is if government leaders uphold the current social distancing mandates and even if they add some.
That would recall the figures seen at the beginning of the pandemic, when more than 2,000 deaths were reported daily for a time in April.
The highest daily average for a week was 2,241, recorded on April 24.
This is how the treatment of covid-19 has changed 5:27
Infections appear to be killing fewer people on average now than at the beginning of the pandemic.
Experts say that, in part, this is due to changes in the way the disease is treated and the increase in the proportion of younger people who become infected.
But as hospitalizations break records, daily death rates could rise further.
"The ratio of deaths to hospitalizations has decreased enormously since the spring," reads the Covid Tracking Project post on Wednesday.
"But it's also true that wherever we see hospitalizations increase, deaths increase two to three weeks later."
CNN's Brandon Miller contributed to this report.
covid-19


/cloudfront-eu-central-1.images.arcpublishing.com/prisa/KMEYMJKESBAZBE4MRBAM4TGHIQ.jpg)