The United States elections have been relatively even, as was the case with the 2016 elections. But this tie situation does not represent what occurs in most of the country's counties, where polarization runs deep: 62% of voters live in territories where a candidate has won by 33 points, that is, with twice the votes of his rival.
Many people hardly have neighbors who vote differently: 5% live in counties where Biden swept (4 to 1) and another 3% live in counties where Donald Trump swept.
Below we analyze what those extreme territories are like.
We take the electoral results in the 3,000 counties that make up the national territory and divide them into six groups, according to who won and by how much.
In one limit are the places where Biden won by 60 points, and in the other those where his Republican rival did.
The counties where the Republican candidate won, as we will see, are more rural and whiter, have lower incomes (although they are not always the poorest), fewer university students, and more workers in industry, construction or the field.
Trump swept rural areas
It is the clearest axis.
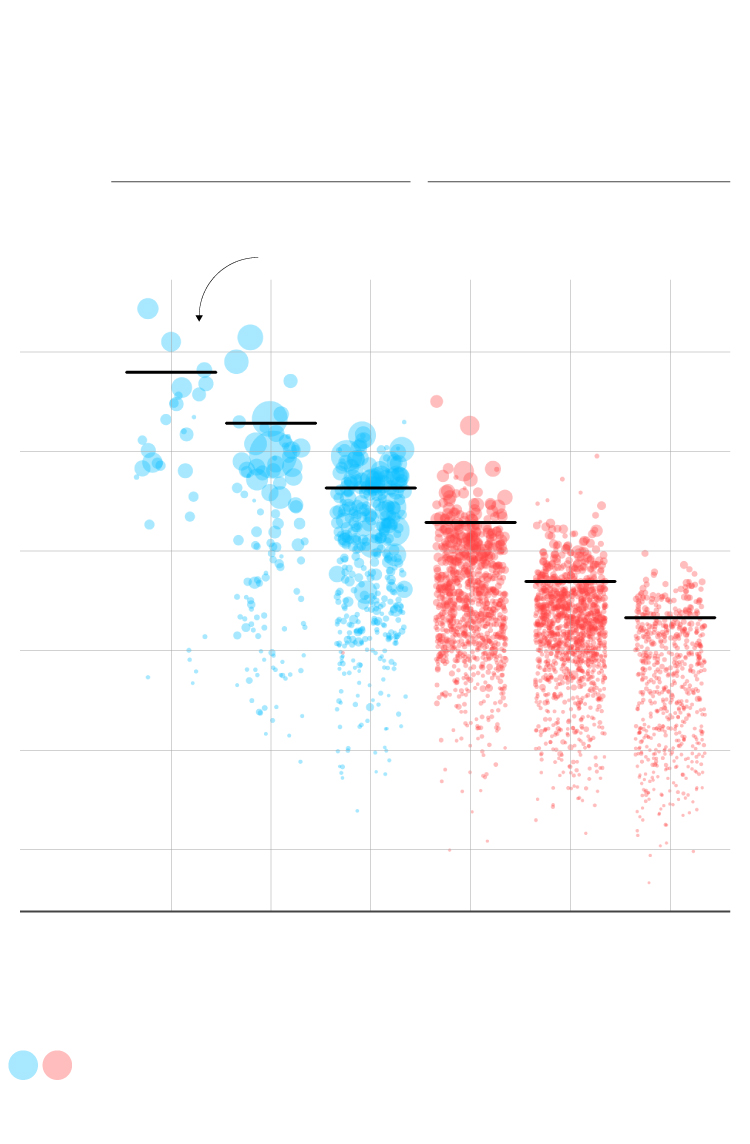
Counties where the Republican wins by 60 points or more are always sparse places, with a weighted average of 20 people per square kilometer.
Instead, Biden's fiefdoms are cities, where the average density exceeds 6,000 inhabitants per square kilometer.
The gap also exists in the most even counties.
The territories that Biden won, but without a clear victory (by less than 33 points), are twice as dense as those where Trump did.
Population density of
counties won:
Biden
Trump
Population
per km²
Weighted average
10,000
6,246
1,925
430
194
100
fifty
twenty-one
1
0
+60
+33
0-33
0-33
+33
+60
Difference in points over the second
Each circle is a county and the size
is proportional to its population
Counties Population Density
in which he won:
Biden
Trump
Population
per km²
Weighted average
10,000
6,246
1,925
430
194
100
fifty
twenty-one
1
0
+60
+33
0-33
0-33
+33
+60
Difference in points over the second
Each circle is a county and the size
is proportional to its population
Population density of counties in which you won:
Biden
Trump
Population
per km²
Weighted average
10,000
6,246
1,925
430
194
100
fifty
twenty-one
1
0
+60
+33
0-33
0-33
+33
+60
Difference in points over the second
Each circle is a county and the size is proportional to its population
The heart of New York is the densest territory in the country and also one of the most Democratic.
Esmeralda County, in the desert southwest of Nevada, is one of the reddest - Trump got five times as many votes as Biden - and also one of the least dense, covering almost 10,000 square kilometers and only 826 inhabitants.
As seen in the graph, Republicans win in vastly more counties than Democrats, but they are less populous - their ladder is built on small rungs.
Targets for Trump
Republican fiefdoms also stand out because they are majority white.
In counties where the outgoing president quadruples his rival, nearly 90% of the people are white.
At the other extreme, in the places that voted massively for Biden, the majority of the population belongs to some racial minority.
Again, the gap is also observed in the border counties, where the candidates won by narrow margins: where Trump did, the whites are 77% and where Biden did, 60%.
Counties White Population
in which he won:
Biden
Trump
Weighted average
100%
88
84
77
75%
60
fifty%
47
39
25%
0
+60
+33
0-33
0-33
+33
+60
Difference in points over the second
Each circle is a county and the size
is proportional to its population
Counties White Population
in which he won:
Biden
Trump
Weighted average
100%
88
84
77
75%
60
fifty%
47
39
25%
0
+60
+33
0-33
0-33
+33
+60
Difference in points over the second
Each circle is a county and the size
is proportional to its population
White population of the counties in which you won:
Biden
Trump
Weighted average
100%
88
84
77
75%
60
fifty%
47
39
25%
0
+60
+33
0-33
0-33
+33
+60
Difference in points over the second
Each circle is a county and the size is proportional to its population
In the blue counties there is more variety: there are some with a white majority, many mixed and others where whites are the minority.
This is the case of the Bronx, in New York, where Biden swept and where 82% of the people are African American or of Latino origin.
In contrast, the ethnic-regional composition of Trump's fiefdoms is sharply white.
The county where it won the most difference is Roberts County (Texas), in which 91% of the population is white.
The fourth is Garfield County (Montana), where whites are 99%.
Trump is more successful where there are fewer university students
The Republican won in just three counties where the majority of the people are college students, while Biden won in the remaining twenty.
Of the 607 counties in which Trump swept, only 15 have a 25% college population and there are none that reach 40%.
Biden swept 30 counties, of which 19 are over 25% college and 10 are over 40%.
University population of the
counties won:
Biden
Trump
60%
Weighted average
40%
36
35
30
25
twenty%
18
14
0
+60
+33
0-33
0-33
+33
+60
Difference in points over the second
Each circle is a county and the size
is proportional to its population
Counties College Population
in which he won:
Biden
Trump
60%
Weighted average
40%
36
35
30
25
twenty%
18
14
0
+60
+33
0-33
0-33
+33
+60
Difference in points over the second
Each circle is a county and the size
is proportional to its population
College population of the counties in which you won:
Biden
Trump
60%
Weighted average
40%
36
35
30
25
twenty%
18
14
0
+60
+33
0-33
0-33
+33
+60
Difference in points over the second
Each circle is a county and the size is proportional to its population
Trump dominates in rural counties around small towns in the Southeast, where college graduates are often fewer, like Clinton County, Kentucky - which has a misleading name.
They are regions with a lower income than the prosperous Democratic urban areas.
However, the relationship between income, education and social class is more complicated than it might appear at first glance.
The counties where Trump easily wins are the least rich, but not the poorest
As the survey and planning data suggested, the most Republican counties have lower median incomes than the majority Democratic counties.
The territories where Trump prevailed by the most margin are non-urban counties with median incomes of $ 24,000 per capita (with 2010 data), while the places where Biden prevailed are clearly more dense and have rents of about $ 33,000.
But the proportion of poor households in each county is different: the relationship between vote and poverty is shaped like a "U".
This suggests that the urban areas where Biden swept are more unequal: there wealth coexists with structural poverty, especially intense among African Americans.
The distribution of income is different in the small
Trumpist,
rural and
whiter
nuclei
, where incomes are perhaps more homogeneous throughout the territory.
Poverty (% of population under
poverty line) of the
counties won:
Biden
Trump
fifty%
40%
30%
Weighted average
twenty%
18
17
14
14
13
13
10%
0
+60
+33
0-33
0-33
+33
+60
Difference in points over the second
Each circle is a county and the size
is proportional to its population
Poverty (% of population below threshold
poverty) of counties
in which he won:
Biden
Trump
fifty%
40%
30%
Weighted average
twenty%
18
17
14
14
13
13
10%
0
+60
+33
0-33
0-33
+33
+60
Difference in points over the second
Each circle is a county and the size
is proportional to its population
Poverty (% of the population below the poverty line)
of the counties in which you won:
Biden
Trump
fifty%
40%
30%
Weighted average
twenty%
18
17
14
14
13
13
10%
0
+60
+33
0-33
0-33
+33
+60
Difference in points over the second
Each circle is a county and the size is proportional to its population
For example, Knox County, in the rural heart of Kentucky, has an even higher proportion of poor households than Philadelphia, the main city of disputed Pennsylvania (37% versus 24%).
But in the first Trump won by 67 points and in the second Biden by 63. In between, there are blue counties like Somerset (New Jersey) and red counties like Douglas (Colorado) where poverty does not even reach 5% of the population.
Of the 20 counties with more than 5,000 inhabitants with the lowest poverty rate, eight were Democrats and 12 were Republicans.
Counties White Population
in which he won:
Biden
Trump
Weighted average
40,000
33,443
32,613
30,950
29,078
25,721
24,417
20,000
0
+60
+33
0-33
0-33
+33
+60
Difference in points over the second
Each circle is a county and the size
is proportional to its population
Counties White Population
in which he won:
Biden
Trump
Weighted average
40,000
33,443
32,613
30,950
29,078
25,721
24,417
20,000
0
+60
+33
0-33
0-33
+33
+60
Difference in points over the second
Each circle is a county and the size
is proportional to its population
Median Income for Earned Counties:
Biden
Trump
Weighted average
40,000
33,443
32,613
30,950
29,078
25,721
24,417
20,000
0
+60
+33
0-33
0-33
+33
+60
Difference in points over the second
Trump prevails in the industrial and agricultural employment territories
Another key to understanding the relationship between vote and wealth in the United States is to look at the type of jobs.
Alleghany (North Carolina) is dominated by agricultural labor, as is Bailey (Texas) or Cassia (Idaho), where Trump took more than two bodies from his rival.
Trump also won in 17 of the 20 counties with the most workers in the production sector, sometimes by a large margin, such as in Murray (Georgia), Tippah (Mississippi) or LaGrange (Indiana).
At the other extreme is Washington DC, the nation's capital, one of the bluest counties in the Union, where 92% of the people work in management, sales or service jobs.
Poverty (% of population under
poverty line) of the
counties won:
Biden
Trump
60%
40%
35
30
Weighted average
25
twenty-one
twenty%
19
16
0
+60
+33
0-33
0-33
+33
+60
Difference in points over the second
Each circle is a county and the size
is proportional to its population
Non-service workers (% of
workers in agriculture, construction
or production) of the counties in which
that won:
Biden
Trump
60%
40%
35
30
Weighted average
25
twenty-one
twenty%
19
16
0
+60
+33
0-33
0-33
+33
+60
Difference in points over the second
Each circle is a county and the size
is proportional to its population
Non-service workers (% of workers in agriculture,
construction or production) of the counties in which you won:
Biden
Trump
60%
40%
35
30
25
Weighted average
twenty-one
twenty%
19
16
0
+60
+33
0-33
0-33
+33
+60
Difference in points over the second
Each circle is a county and the size is proportional to its population
Trump sweeps certain parts of the country
Republican fiefdoms are concentrated in a few states: they are counties in the heart of the Midwest (Wyoming, North Dakota, Idaho),
from the Old South (Alabama, Kentucky, Tennessee) or at the intersection between the two (Arkansas, Oklahoma, Missouri, or West Virginia).
The most spectacular case is Wyoming: 74% of the people there live in counties where Trump doubled, at least, the votes of Biden.
At the other extreme are Massachusetts, Vermont or the District of Columbia.
These counties reflect the new division of the American vote.
Republicans are most successful where the rural component, the white race, the (relatively) modest income and the manual jobs are combined.
The increasingly defined fracture characterizes the places where Trump's messages are most popular, also marking the present and possible future of the Republican Party.
Methodology and sources.
The election results in each county come from the provisional official count as of November 12;
represent the difference in percentage points between the two main candidates, which almost always comprises practically all of the votes, so it is equal to the margin of victory or defeat of each of the two The sociodemographic data comes from
this public domain collection
.
Most of the data is from 2016, but the income data is from 2010.
/cloudfront-eu-central-1.images.arcpublishing.com/prisa/P6ZR6RBRZ67Y5KKAUQCHBLW4GI.jpg)