
Number of people tested, infected, hospitalized, in intensive care ... Until the death toll.
The Covid-19 epidemic gives rise to an avalanche of figures.
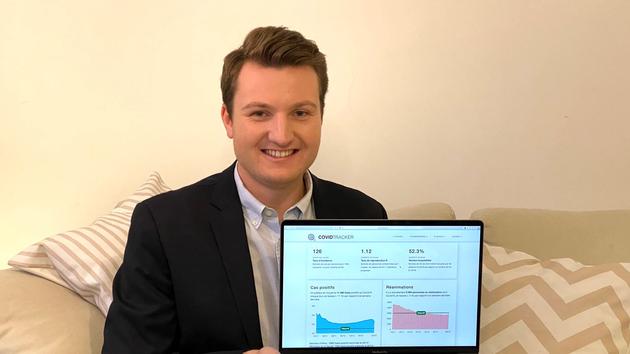
But it was not until the initiative of a 24-year-old data scientist, Guillaume Rozier, to see the first tracking graphs appear, first on social networks, then on a dedicated site, CovidTracker.
Simple, easy to understand and regularly updated, these graphics quickly won over the media.
The young man toured the TV shows and even received a call from the office of the Minister of Health.
This new glory did not turn the well-made head of Guillaume Rozier, just graduated from Telecom Nancy.
Le Savoyard, specializing in
“artificial intelligence and mass data”,
began collecting the available data on Covid-19 in March.
Trainee in a bank in Luxembourg, he is faced with an ubiquitous situation:
“I could not stay in Luxembourg.
This article is for subscribers only.
You have 73% left to discover.
Subscribe: 1 € the first month
Can be canceled at any time
I ENJOY IT
Already subscribed?
Log in