
This is how Congress will change for the 1:23 census data
Washington (CNN)
- The United States Census Bureau fulfilled its ten-year duty on Monday by publishing the new population indexes, which will serve to redistribute the seats in the House of Representatives among the 331 million people of the United States.
The new figures highlight the country's changing demographics, showing how the southern and western states are increasing in population, while their counterparts in the upper Midwest and Northeast are decreasing in size.
US population growth between 2010 and 2020 was the second slowest in history
The 2020 census shows that the US population grew from approximately 308.7 million in 2010 to 331.4 million, an increase of 7.35%.
This is the slowest population growth since 1930-1940, the decade of the Great Depression.
The American population has quadrupled since the 1900 census.
ANALYSIS |
The 6 most important conclusions of the redistribution of the Census in the United States
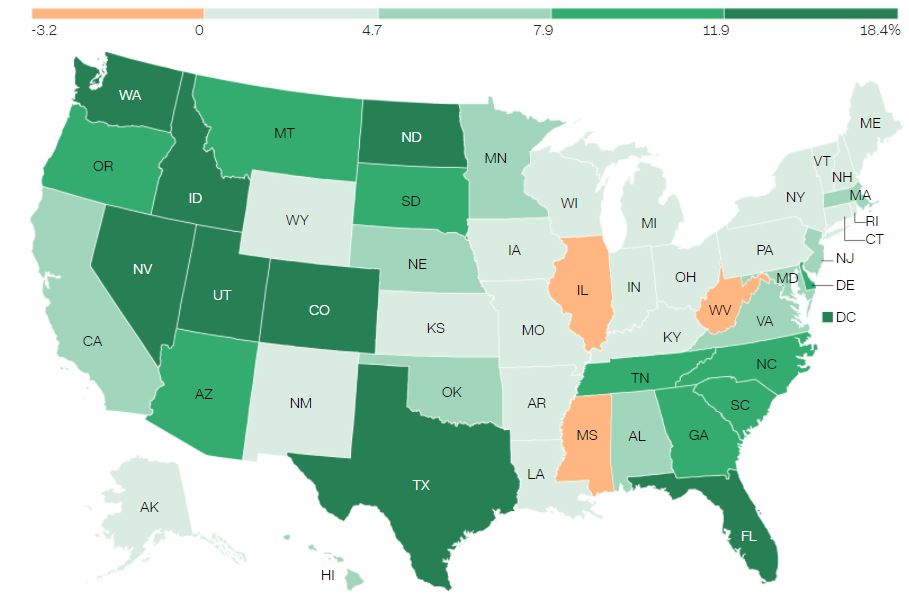
The southern and western states posted large increases in the past decade
The south and west recorded the highest population growth between 2010-2020.
Percentage Change in State Population, 2010-2020
Source: US Census Bureau
Graph Renée Rigdon, CNN
The 2020 Census shows that the American population in the southern states grew from approximately 114.6 million in 2010 to 126.3 million, an increase of nearly 12 million residents.
The West grew by 6.6 million to 78.6 million residents in 2020.
Seats won and lost in the US House of Representatives after the 2020 census
The state population totals will be used in the redistricting process that occurs every ten years, at which point some states win new seats in Congress and others lose them.
On this occasion, Texas, Florida, Colorado and Montana, among others, will win seats.
Since the last decennial Census count in 2010, Texas increased two seats, while New York and California lost one seat each.
advertising
- CNN's Dan Merica contributed to this report.
Census 2020