In seven years, the right has taken a huge leap in Andalusia: it has gone from garnering 38% support in 2015 to 60% in 2022. Its progress has been transversal, almost in every town and in every city.
However, a close look at street-by-street voting reveals some interesting patterns.
Are these:
1. The right has grown much more in the poorest neighborhoods of Andalusia
The sum of PP, Vox and Ciudadanos has doubled their votes in the poorest sections of Andalusia, going from 20% to 50% in the last seven years.
Instead, it has barely risen in the richest neighborhoods, where it was already strong.
The income profile of the right-wing sum is much more transversal than in 2015. Then it had triple support in the richest neighborhoods compared to the poorest, but now it barely rises 40% from one another.
The transformation began in 2018 and has been consolidated in 2022.
In a certain way, it is natural that the right rises more in poor neighborhoods, because there it had more room for growth.
But the phenomenon is relevant.
First, because it demonstrates the ability of the right to penetrate neighborhoods that had been fiefdoms of the left.
And second, because there is another element to consider…
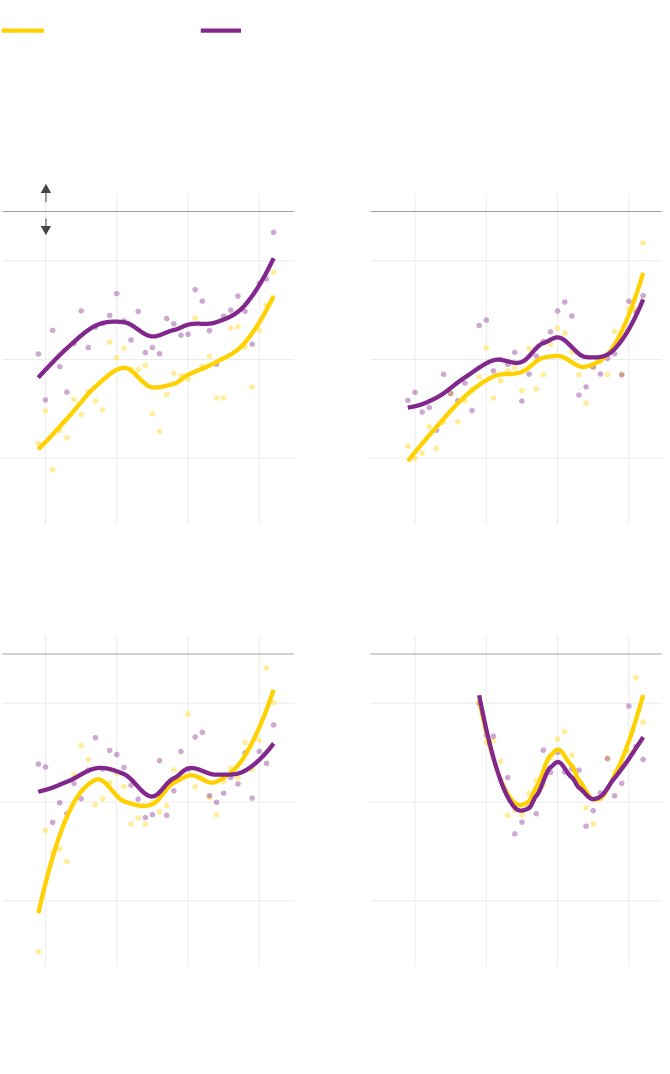
2. The right has also grown more in poor neighborhoods when they were not on the left
Imagine two neighborhoods that voted left with equal strength in 2015, if one is poorer than the other, that's where the right has probably risen the most.
This is what the following graph shows, which represents the rise of the right between 2015 and 2022 in each census section, classified according to whether they were more or less on the left in 2015 and according to whether they were more or less rich.
For example, looking at the third column (the neighborhoods where the left had achieved 70-80% in 2015), what we see is that the right won more votes the poorer the neighborhood.
In those left-wing neighborhoods, when they were very poor, it rose 33 points, while in the rich it only rose 21. And that pattern always repeats itself.
Another example is the neighborhoods where the vote was distributed and the right was around 40-50% of the vote, which is about 1,000 sections.
Among them there are 50 that are among the richest in Andalusia, and there the right rose 14 points on average;
on the other hand, in the 40 that are among the poorest, the right rose 25 points.
3. The right has also grown more in neighborhoods where fewer university students live
It is not a surprise, because income and educational level always go hand in hand, especially when we look at neighborhoods.
Once again we see the right becoming transversal, where it was not: in 2015, the sum of PP and Ciudadanos achieved 63% of votes in neighborhoods where there are more than 35% university students, while it did not exceed 22% where they were less than 3%.
Those percentages have increased to 73% and 51%, respectively.
4. The right has risen more in towns and small cities
Again, it will have contributed that there was more room for growth, but still.
In 2015, it got considerably fewer votes in cities with 8,000 to 17,000 inhabitants (32%) than in larger ones (40%);
instead, now it is around 60% in all of them.
5. This turn to the right has also been facilitated by the abstention of the left
The rebalancing of Andalusia will have been partly pushed by the absence at the polls of many ballots from left-wing voters.
In 2018 and 2022 there has been little voting, but the data also shows that this has happened especially in the traditionally left-wing territories.
As the graph shows, participation has plummeted in left-wing neighborhoods, going from 62% to 47% between 2015 and 2022. In contrast, in more right-wing neighborhoods it did not drop, but rose a little.
6. However, not everything is participation: Andalusians also declare themselves more right-wing than ever in 30 years
In addition to the vote, in these seven years the ideology with which the citizens of the region identify has changed.
Men and women of all generations are now more to the right than ever.
For example, women born around 1950 have gone from being located on average in the ideological 4.7 (with 1 being the extreme left and 10 the extreme right), to being placed above 5.
All generations turn right.
Mean annual location on the left or right axis (on a scale where 1 is farthest to the left and 10 is farthest to the right)
Men
Women
born between
1939 and 1960
born between
1960 and 1970
More than rights
more to the left
5.0
5.0
4.5
4.5
4.0
4.0
1990
2000
2010
2020
1990
2000
2010
2020
1970 - 1980
1980 - 1990
5.0
5.0
4.5
4.5
4.0
4.0
1990
2000
2010
2020
1990
2000
2010
2020
CIS / THE COUNTRY
Men
Women
born between
1939 and 1960
born between
1960 and 1970
More than rights
more to the left
5.0
5.0
4.5
4.5
4.0
4.0
1990
2000
2010
2020
1990
2000
2010
2020
1970 - 1980
1980 - 1990
5.0
5.0
4.5
4.5
4.0
4.0
1990
2000
2010
2020
1990
2000
2010
2020
CIS / THE COUNTRY
Men
Women
Born between 1939-1960
1960 - 1970
More than rights
more to the left
5.0
5.0
4.5
4.5
4.0
4.0
1990
2000
2010
2020
1990
2000
2010
2020
1970 - 1980
1980 - 1990
5.0
5.0
4.5
4.5
4.0
4.0
1990
2000
2010
2020
1990
2000
2010
2020
CIS / THE COUNTRY
Since 2015, all the generations born before 1990 have moved to the right. It has happened with those who were young in the Transition, and with their children, born in the late seventies or eighties.
And it is not an effect coupled with older age —by which people would go more to the right as they turn years—, but rather that there has really been a new movement to the right.
Almost all age groups, people between 35 and 50 years old or between 50 and 65, are more to the right than ever before.
All generations turn right.
Mean annual location on the left or right axis (on a scale where 1 is farthest to the left and 10 is farthest to the right)
Men
Women
18-35 years
35-50 years
More than rights
5.5
5.5
more to the left
Crisis
Catalonia
5.0
5.0
4.5
4.5
2000
2005
2010
2015
2020
2000
2005
2010
2015
2020
50-65 years
Over 65 years
5.5
5.5
5.0
5.0
4.5
4.5
2000
2005
2010
2015
2020
2000
2005
2010
2015
2020
CIS / THE COUNTRY
Men
Women
18-35 years
35-50 years
More than rights
5.5
5.5
more to the left
Crisis
Catalonia
5.0
5.0
4.5
4.5
2000
2005
2010
2015
2020
2000
2005
2010
2015
2020
50-65 years
Over 65 years
5.5
5.5
5.0
5.0
4.5
4.5
2000
2005
2010
2015
2020
2000
2005
2010
2015
2020
CIS / THE COUNTRY
Men
Women
18-35 years
35-50 years
More than rights
5.5
5.5
more to the left
Crisis
Catalonia
5.0
5.0
4.5
4.5
2000
2005
2010
2015
2020
2000
2005
2010
2015
2020
50-65 years
Over 65 years
5.5
5.5
5.0
5.0
4.5
4.5
2000
2005
2010
2015
2020
2000
2005
2010
2015
2020
CIS / THE COUNTRY
Metodología. Los datos de votos de secciones provienen de la Junta de Andalucía. Las secciones censales son divisiones administrativas de tamaño variable donde viven unas 1.000 personas. A veces son una sola manzana y otras veces un área más extensa de chalets o polígonos.
Una cautela a tener en cuenta con los datos de ubicación ideológica del CIS es que el centro cambió su metodología en 2020 y después muchos barómetros se han hecho por teléfono, en lugar de presencialmente. Desde entonces más gente se ubica en el 1 y el 10 ideológico, en los extremos, lo que podría haber tenido algún efecto también sobre las ubicaciones medias. No obstante, hemos calculado las ideologías medias quitando esos valores —1 y 10— y la evolución es casi idéntica: la derechización se ve igual.
50% de descuento
Exclusive content for subscribers
read without limits
subscribe
I'm already a subscriber
/cloudfront-eu-central-1.images.arcpublishing.com/prisa/WVHE5ROKWZFXDAPCRF26MBSEKQ.jpg)


/cloudfront-eu-central-1.images.arcpublishing.com/prisa/T4T5B27RLNDT3K5CEDTOP5QLL4.jpg)