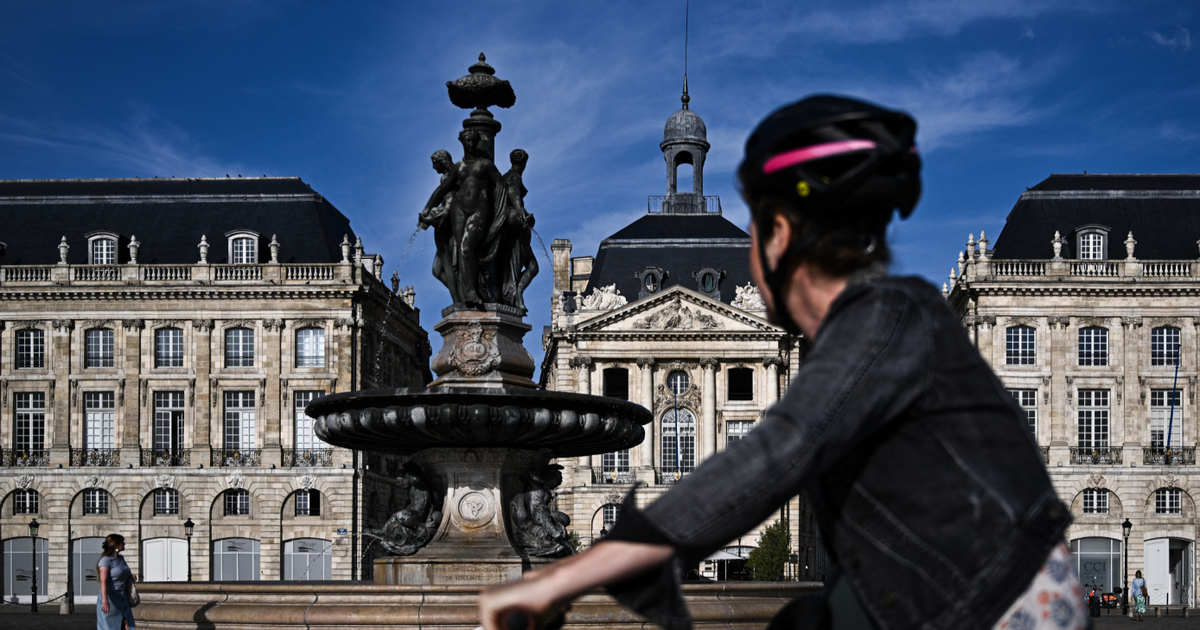
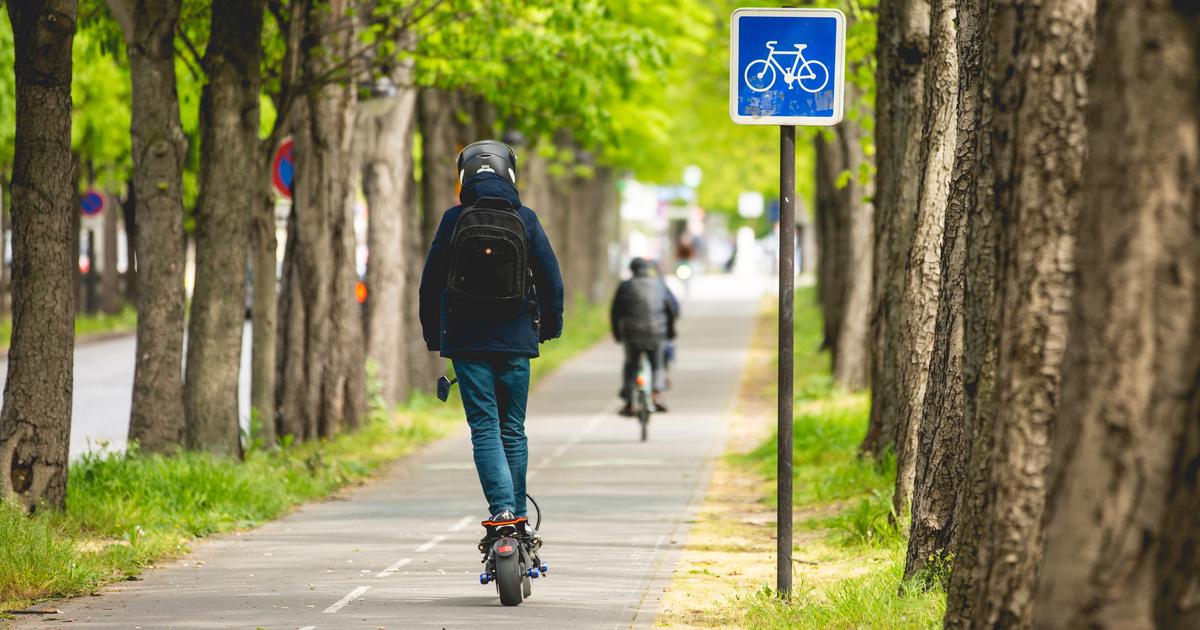
The pandemic is having an unexpected effect: many cities are taking space away from the car to give it to the bicycle, a means of transport that reduces pollution and favors healthy, active and safe mobility against the virus.
The cities that already promoted this idea in recent years have taken advantage of the situation to accelerate their transformation through temporary bike lanes - made without great costs with paint or cones -: this is the case of Paris, the city whose rapid transformation amazes in Europe , or Bogotá, which has doubled the percentage of cyclists with 80 additional kilometers of bicycle lanes.
In contrast, others have made no more than cosmetic or insufficient changes.
“Any cycling infrastructure is a good solution to get people to cycle in a sustainable way.
If you put bike lanes in, people will use them.
It took a pandemic for many cities to start thinking about cycling, ”says Mike Colville-Andersen, an expert on sustainable urban planning.
“The temporary bike lanes are very dependent on the political will that the city already has to take effective measures to increase the number of people who pedal.
For those who had clear plans, this has served as an acceleration.
It is a cross-cutting element that has occurred throughout Europe and even in some cities in the US and Latin America ”, says David Lois, researcher at the Transport Research Center of the Polytechnic of Madrid.
However, not all extensions that are being made are the same.
The new bike lanes in Paris are wide and take up space from the car, unlike those in Madrid, where they also tend to park vehicles in double row.
Barcelona has made positive examples, such as General Roger de Llúria, and others shared with the bus, such as the one on the Sants Creu Coberta road, which are more unsafe.
"Effective quick solutions have depended on the Administrations having something worked out," says Esther Anaya, a researcher on mobility at Imperial College London.
Examples of bike lanes created by the
pandemic in various cities
Paris
Madrid
Barcelona
Vitoria
Examples of bike lanes created by the pandemic
in various cities
Paris
Madrid
Barcelona
Vitoria
Examples of cycle lanes created by the pandemic in various cities
Paris
Madrid
Barcelona
Vitoria
Examples of cycle lanes created by the pandemic in various cities
Paris
Madrid
Barcelona
Vitoria
In Vitoria they have been made on the road, marked with paint and separated with bollards, as in Avenida de los Huetos.
“It is not enough just to put the lanes to work, but it is a first step and they are actions that if it had not been in the key of covid they would surely have been very difficult to execute, people would have said that how are you going to remove a lane to cars ”, comments Juan Carlos Escudero, head of the Area of Information and Innovation for Sustainability of the Vitoria-Gasteiz City Council.
A global change
The commitment to cycling has been going for years in European cities such as Amsterdam, Oslo or Copenhagen, but the pandemic - and the concern of citizens for health and the environment - has prompted more and more capitals to follow in its wake.
During the de-escalation, Berlin built 15 kilometers of temporary infrastructure, while London created more than 30 kilometers of permanent cycle lanes - and the mayor promises to multiply infrastructure by 10 by 2025 throughout the city.
Brussels, whose network spanned 130 kilometers, has built 40 provisionals, with which the number of cyclists has increased by 40%.
Lisbon, which had only 105 kilometers in May, wants to double that number at the start of 2021.
Berlin
(Germany)
London
(United R.)
10 km
Paris
(France)
Brussels
(Belgium)
10 km
Oslo
(Norway)
Lisbon
(Portugal)
10 km
Bogota
(Colombia)
Mexico DF
(Mexico)
10 km
Berlin Germany)
London (UK)
10 km
Brussels, Belgium)
Paris France)
10 km
Oslo (Norway)
Lisbon Portugal)
10 km
Bogota Colombia)
Mexico DF (Mexico)
10 km
Berlin Germany)
London (UK)
10 km
Oslo (Norway)
Mexico DF (Mexico)
Brussels, Belgium)
10 km
10 km
Amsterdam
(Holland)
Lisbon
(Portugal)
Paris
(France)
Bogota
(Colombia)
10 km
10 km
Berlin Germany)
London (UK)
10 km
Brussels, Belgium)
Oslo (Norway)
Mexico DF (Mexico)
10 km
10 km
Lisbon Portugal)
Paris France)
Bogota Colombia)
Amsterdam (Holland)
10 km
10 km
“The temporary bike lanes work in large avenues, with continuity and coherence.
This allows someone who is going to start to plan a route and achieves a perceptual reduction in the risk of pedaling, which increases the number of cyclists very quickly.
The most successful cities in the world, such as Paris or Bogotá, have measured cyclists before and after, and this data then helps to make the measurements definitive, ”explains David Lois.
The Colombian capital has been one of the most ambitious cities in the world on this issue: to the 550 kilometers of bicycle lanes it added another 80 during the pandemic.
Although they still have fewer daily trips on pedals than last year (580,000 compared to 880,000), they have doubled the importance of two wheels: if in 2019 6.6% of journeys were made by bike, now they are 13%.
Meanwhile, Paris has seen its cyclists grow by 65% this year.
“Many cities were already experiencing a bicycle boom, but the pandemic has taken it further.
Cities that were planning infrastructures in the coming years are now doing it in just a few months, ”says urban planner Brent Toderian.
This is the case of Mexico City, which created a bike path of more than 12 kilometers in Insurgentes, an avenue that runs through the megalopolis.
The cycling network in Spanish cities
We have analyzed the cycling networks of the 10 most populated cities in Spain, as well as three medium-sized ones (Valladolid, Vitoria and San Sebastián).
A quick glance shows that some - such as Vitoria, Valencia, Zaragoza, San Sebastián or Seville - have a wide network to move by bike safely, while others - such as Madrid, Malaga, Bilbao or Las Palmas - have hardly any infrastructure. to move through the urban fabric.
The rest are in an intermediate situation.
Murcia has more bike lanes per inhabitant than Barcelona, but the network of the Catalan capital is of higher quality and more useful.
Network of kilometers of bike lanes
per 100,000 inhabitants
Vitoria
49.6 km.
/100,000 inhabitants
Saint Sebastian
37.4 km.
/100,000 inhabitants
Valladolid
36.2 km.
/100,000 inhabitants
5 km
Palm
(Majorca)
27.6 km.
/100,000 inhabitants
Seville
27.6 km.
/100,000 inhabitants
Valencia
20.4 km.
/100,000 inhabitants
5 km
Saragossa
20.0 km.
/100,000 inhabitants
Murcia
19.6 km.
/100,000 inhabitants
Barcelona
14.1 km.
/100,000 inhabitants
5 km
Madrid
8.3 km.
/100,000 inhabitants
Bilbao
9.8 km.
/100,000 inhabitants
5 km
Las Palmas de
Gran Canaria
6.6 km.
/100,000 inhabitants
Malaga
7.8 km.
/100,000 inhabitants
5 km
Network of kilometers of bike lanes in each city
per 100,000 inhabitants
Vitoria
49.6 km.
/100,000 inhabitants
Saint Sebastian
37.4 km.
/100,000 inhabitants
Valladolid
36.2 km.
/100,000 inhabitants
5 km
Palm
(Majorca)
27.6 km.
/100,000 inhabitants
Seville
27.6 km.
/100,000 inhabitants
Valencia
20.4 km.
/100,000 inhabitants
5 km
Saragossa
20.0 km.
/100,000 inhabitants
Murcia
19.6 km.
/100,000 inhabitants
Barcelona
14.1 km.
/100,000 inhabitants
5 km
Bilbao
9.8 km.
/100,000 inhabitants
Madrid
8.3 km.
/100,000 inhabitants
5 km
Las Palmas de
Gran Canaria
6.6 km.
/100,000 inhabitants
Malaga
7.8 km.
/100,000 inhabitants
5 km
Network of kilometers of bike lanes in each city per 100,000 inhabitants
Vitoria
49.6 km.
/100,000 inhabitants
Saint Sebastian
37.4 km.
/100,000 inhabitants
Valladolid
36.2 km.
/100,000 inhabitants
Palma (Majorca)
27.6 km.
/100,000 inhabitants
5 km
Valencia
20.4 km.
/100,000 inhabitants
Seville
27.6 km.
/100,000 inhabitants
Saragossa
20.0 km.
/100,000 inhabitants
5 km
Bilbao
9.8 km.
/100,000 inhabitants
Murcia
19.6 km.
/100,000 inhabitants
Barcelona
14.1 km.
/100,000 inhabitants
5 km
Las Palmas de
Gran Canaria
6.6 km.
/100,000 inhabitants
Malaga
7.8 km.
/100,000 inhabitants
Madrid
8.3 km.
/100,000 inhabitants
5 km
Network of kilometers of bike lanes in each city per 100,000 inhabitants
Vitoria
49.6 km.
/100,000 inhabitants
Saint Sebastian
37.4 km.
/100,000 inhabitants
Valladolid
36.2 km.
/100,000 inhabitants
Palma (Majorca)
27.6 km.
/100,000 inhabitants
5 km
Seville
27.6 km.
/100,000 inhabitants
Valencia
20.4 km.
/100,000 inhabitants
Saragossa
20.0 km.
/100,000 inhabitants
5 km
Bilbao
9.8 km.
/100,000 inhabitants
Murcia
19.6 km.
/100,000 inhabitants
Barcelona
14.1 km.
/100,000 inhabitants
5 km
Las Palmas de
Gran Canaria
6.6 km.
/100,000 inhabitants
Madrid
8.3 km.
/100,000 inhabitants
Malaga
7.8 km.
/100,000 inhabitants
5 km
The quality of the networks is very diverse, ranging from wide and well-connected bike lanes to narrow bike sidewalks - where there is often conflict with pedestrians - to mere signs on the ground that do not separate cyclists from traffic - and they are therefore insecure.
Many cities even consider “cycling routes” shared with cars and limited to 30 lanes per hour — called cycle lanes — a limitation that vehicles violate and does not encourage pedaling.
Municipal maps include all of these categories and do not usually differentiate them, making comparison between cities difficult.
In addition, when examining a network it is not enough to just count the length of the infrastructures, it is also important to see its usefulness.
Half of the 260 kilometers of bike lanes in Madrid run through the outskirts or parks and are used more for leisure on weekends;
on the other hand, the 230 in Barcelona or the 160 in Valencia mostly run through the center.
That leads to more people pedaling around.
Thus, in Barcelona (1.6 million inhabitants) there are 200,000 trips by bicycle every day, which represents 2.9% of the modal split (almost three out of every 100 people use the bike as a means of transport), and the City Council puts the post-pandemic increase at 12%.
In Valencia (800,000 inhabitants) they reach 85,000 trips (4.8% of the trips).
Madrid (3.2 million), on the other hand, only achieved 0.6% of the modal split, and also did not have updated data on the use of the bike.
In fact, cyclist mobility data is a headache and many municipalities do not have them available or do not update them, making it difficult to assess whether the networks or provisional measures are effective.
There are cities that have been improving their network of cycling routes for years and the pandemic has helped them to accelerate their plans: this is the case of Barcelona (21 new kilometers, two of them shared with the bus), Vitoria (eight) or Valladolid, which built eight kilometers of bike lanes and has increased cyclists by 20%.
Cities like Seville or Zaragoza, which already had extensive infrastructure networks, have not taken advantage of the situation to expand them, while Madrid has done so but with a poor design.
The extension in Palma de Mallorca is only two kilometers long.
Valencia has just announced 15 new bike lanes for the next few months.
Quality of bike lanes
The little importance that has been given to this means of transport in most cities in Spain until recently explains why some bike lanes end abruptly, without continuity, and others have serious problems.
“You can't make a bike lane and not fix crossings, because you leave people in the middle of the traffic jungle.
That would never happen with cars, nobody forgets to put a traffic light or paint the line of the lanes ”, complains Esther Anaya.
Some black spots of the networks
Bike lane just
abrupt way in Cibeles (Madrid)
Conflict with pedestrians on the Paseo de la Senda in Vitoria
Double row bike path in av.
from Porto to Madrid
Dirt bike path in the Plaza de Tetuán in Barcelona
Some black spots of cycling networks
Bike lane just
abrupt way in Cibeles (Madrid)
Conflict with pedestrians
on the Paseo de la Senda
in Vitoria
Double row bike path
in av.
from Porto to Madrid
Dirt bike lane in Plaza de Tetuán
from Barcelona
Some black spots of cycling networks
Double row bike path
in av.
from Porto to Madrid
Bike path that ends abruptly in Cibeles (Madrid)
Bike path cut off when arriving at Plaza de España in Barcelona
Conflict with pedestrians on the Paseo de la Senda in Vitoria
Dirt bike path in the
Tetouan square
from Barcelona
Some black spots of cycling networks
Double row bike path
in av.
from Porto to Madrid
Bike lane cut to
get to the Plaza
Spain in Barcelona
Bike lane just
abrupt way in Cibeles
(Madrid)
Conflict with pedestrians
on the Paseo de la Senda
in Vitoria
Dirt bike path in the
Tetouan square
from Barcelona
As an example, we trace some black spots of the bicycle infrastructures in four Spanish cities with the help of cycling groups.
Conflictive sections in Madrid
Conflicts with
parking lots
in av.
of the bullfighters
Narrow bike sidewalks
in av.
Donostiarra
Circulation between traffic
in Atocha street
Conflict with pedestrians
in Madrid Rio
5 km
Conflictive sections in Madrid
Conflicts with
parking lots
in av.
of the bullfighters
Narrow bike sidewalks
in av.
Donostiarra
Circulation between traffic
in Atocha street
Conflict with pedestrians
in Madrid Rio
5 km
Conflictive sections in Madrid
Conflicts with car parks
in av.
of the bullfighters
Narrow bike sidewalks
in av.
Donostiarra
Sidewalk bike on Serrano street
Circulation between traffic
in Atocha street
Conflict with pedestrians
in Madrid Rio
2 km
Conflictive sections in Madrid
Conflicts with car parks
in av.
of the bullfighters
Narrow bike sidewalks
in av.
Donostiarra
Sidewalk bike on Serrano street
Circulation between traffic
in Atocha street
Conflict with pedestrians
in Madrid Rio
2 km
Conflictive sections in Barcelona
Problematic sidewalks
in Paseo de Valldaura
Stops and crosses with
public transport
in av.
Diagonal
Conflicts with
pedestrians
on the sea trip
5 km
Conflictive sections in Barcelona
Problematic sidewalks
in Paseo de Valldaura
Stops and crosses with
public transport
in av.
Diagonal
Conflicts with
pedestrians
on the sea trip
5 km
Conflictive sections in Barcelona
Problematic bike sidewalks
in Paseo de Valldaura
Stops and crossings with transport
public in av.
Diagonal
Work areas
in Plaça de Gloriès
Conflicts with pedestrians
on the sea trip
Narrow pedestrian streets
on Enrique Granados street
2 km
Conflictive sections in Barcelona
Problematic bike sidewalks
in Paseo de Valldaura
Stops and crossings with transport
public in av.
Diagonal
Work areas
in Plaça de Gloriès
Conflicts with pedestrians
on the sea trip
Narrow pedestrian streets
on Enrique Granados street
2 km
Conflictive sections in Malaga
Architectural elements
as in Competa street
Proliferation of terraces
on Mart Street.
Maldonado
Dangerous crosses
in av.
by Cervantes
Offline lanes
on the street Sillita
of the Queen
2 km
Conflictive sections in Malaga
Architectural elements
as in Competa street
Proliferation of terraces
on Mart Street.
Maldonado
Dangerous crosses
in av.
by Cervantes
Offline lanes
on the street Sillita
of the Queen
2 km
Conflictive sections in Malaga
Architectural elements
as in Competa street
Proliferation of terraces
on Mart Street.
Maldonado
Dangerous crosses
on Cervantes avenue
Offline lanes
in the street Sillita de la Reina
Conflicts with vehicles
sheltered
in the Guadalhorce industrial estate
2 km
Conflictive sections in Malaga
Architectural elements
as in Competa street
Proliferation of terraces
on Mart Street.
Maldonado
Dangerous crosses
on Cervantes avenue
Offline lanes
in the street Sillita de la Reina
Conflicts with vehicles
sheltered
in the Guadalhorce industrial estate
2 km
Conflictive sections in Vitoria
Narrow streets and
nonsense
in Gorbea streets or
Eulogio Serdán
Conflicts with
vehicles
on San Antonio street
2 km
Conflictive sections in Vitoria
Narrow streets and
nonsense
in Gorbea streets or
Eulogio Serdán
Conflicts with
vehicles
on San Antonio street
2 km
Conflictive sections in Vitoria
Narrow streets and nonsense
in Gorbea streets or
Eulogio Serdán
Conflicts with vehicles
on San Antonio street
2 km
Conflictive sections in Vitoria
Narrow streets and nonsense
in Gorbea streets or
Eulogio Serdán
Conflicts with vehicles
on San Antonio street
2 km
Cities that have not yet joined this trend can miss a unique moment.
"We have the opportunity to use the pandemic in a positive way to change the mobility of our cities," summarizes Colville-Andersen.
"If we want to avoid an explosion of new cars when the economic recovery comes, we need to make more attractive options such as cycling, walking or public transport," warns Brent Toderian.
The temporary infrastructure is a good emergency strategy, but we must go further.
“With the de-escalation, without cars, there was an explosion of bikes in Spanish cities, but as soon as the traffic returned, the use of the bike dropped," complains Esther Anaya. "Months have passed and we continue with temporary bike lanes.
Behavioral changes in mobility need good support.
It is not enough to facilitate change, it must be maintained ”, he concludes.
Methodology
We have selected the maps of the bike lanes on the pages of town halls and official bodies and have compared them with cycling associations in each Spanish city, as well as with correspondents in different countries.
We have considered the typology of bike lanes included in the Traffic Law, unifying them all in the same color.
We have excluded shared lanes with cars or buses as they are not considered an additional infrastructure, and also shared routes with pedestrians when there is no separation.
We have divided the total figure for each city by the inhabitants collected by the National Institute of Statistics to show the kilometers of cycling infrastructure per 100,000 inhabitants.
With information from
Silvia Ayuso, Ana Carbajosa, Felipe Sánchez, Guillermo Abril, Rafa de Miguel
and
Santiago Torrado
.
Acknowledgments: Castellana y Pedalibre bike path (Madrid), Bicycle Club de Catalunya (BACC), Valencia by bike,
Biciutat de Mallorca,
Biziosona (Bilbao), Murcia by bike, Valladolid Cycling Assembly, Pedaleza (Zaragoza), Acontramano (Seville) , Round Wheels (Malaga) and Urban Cyclists (Vitoria).
To know the most important news on Climate and Environment of EL PAÍS, sign up here for our
weekly
newsletter
.
Follow the Climate and Environment section on
and
/cloudfront-eu-central-1.images.arcpublishing.com/prisa/O5KJZWDZ2ZF3PMFCA7GSGYAIW4.jpg)