
From the explosive growth of childhood to the slow decline of old age, every change in our brains can finally be measured and evaluated against reference standards.
To make this possible for the first time is BrainChart, an interactive tool made of curves that describe the standards of growth and aging of the human brain from 0 to 100 years.
They were obtained on the basis of brain scans of over 100,000 individuals from around the world, for a total of nearly a petabyte of data analyzed using approximately 2 million hours of computation time.
The result, published in Nature by a team led by the universities of Cambridge and Pennsylvania,
BrainChart could represent a breakthrough in medicine, similar to the one marked over 200 years ago by the introduction of growth curves for weight and height assessment in infants and children.
Until now, no one has been able to develop such tools for monitoring brain evolution.
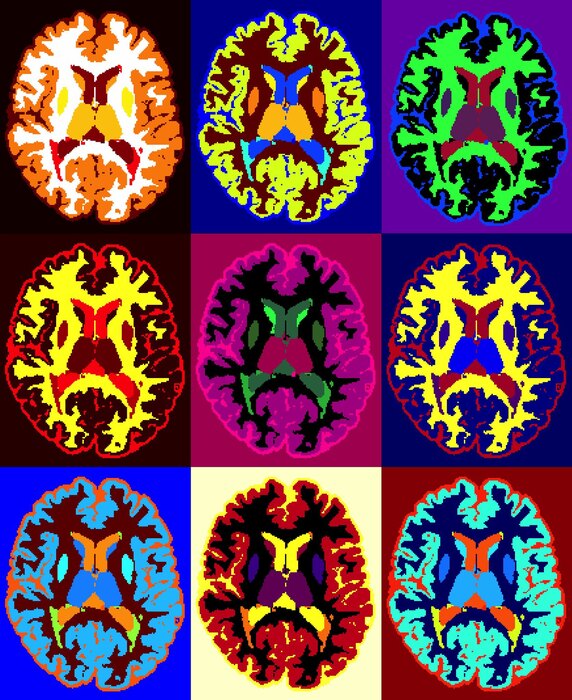
To fill this gap, the researchers analyzed nearly 124,000 MRI brain scans of more than 100,000 individuals of all ages, from 115 days after conception up to 100 years old.
By putting together imaging data from 10 studies conducted around the world, it was possible to map changes in the human brain over the course of life by defining different growth curves.
Thanks to BrainChart (also available on the brainchart.io platform of the same name), some fundamental stages of brain development have already been identified that had so far been missed.
In particular, gray matter volume has been observed to rapidly increase from mid-gestation, peak just before age six, and then slowly begin to decline.
White matter volume also increases rapidly from mid-gestation to early childhood and peaks just before age 29, while the decline accelerates after age 50.
The volume of subcortical gray matter (which controls basic bodily functions and behaviors) peaks in adolescence, at exactly 14 and a half years old.
"We are still in the infancy with our brain graphs: so far we have shown that it is possible to create these tools by putting together large amounts of data," says Richard Bethlehem, of the University of Cambridge's Department of Psychiatry.
"The graphs are beginning to provide interesting insights into brain development and our ambition for the future as we integrate new datasets and refine curves is that they can become part of clinical routine. They could be used to evaluate patients in screenings. for Alzheimer's, for example, allowing us to identify the signs of neurodegeneration by comparing how quickly the brain volume has changed compared to their peers. "